HRD
Hertzsprung–Russell diagram
Hertzsprung–Russell diagram
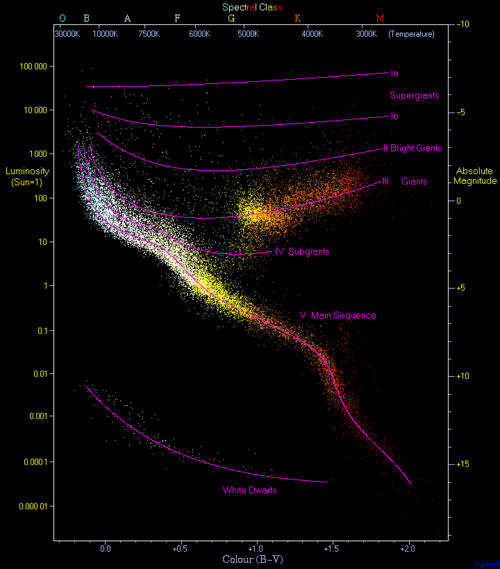
Scatter plot of stars showing the relationship of luminosity to stellar classification
The Hertzsprung–Russell diagram, abbreviated as H–R diagram, HR diagram or HRD, is a scatter plot of stars showing the relationship between the stars' absolute magnitudes or luminosities versus their stellar classifications or effective temperatures. The diagram was created independently in 1911 by Ejnar Hertzsprung and by Henry Norris Russell in 1913, and represented a major step towards an understanding of stellar evolution.
Read on Wikipedia License Image-Source